Friday, April 15, 2011

04.15.11 Market Wrap

Economic Data
CN:Consumer Price Index

Prior
Consensus
Actual
M/M % Change


-0.2 
Y/Y % Change
4.9 
5.2 
5.4 
 CN:GDP
Y/Y % Change
9.8 
9.6 
9.7 

CN:Industrial Production
Yr/Yr % change                    14.9 %                      14.0 %              14.4 %

CN:Producer Price Index
M/M % Change


0.6 
Y/Y % Change
7.2 
7.2 
7.3 
CN:Retail Sales 
M/M % Change


1.3 
Y/Y % Change
11.6 
16.5 
17.4 

US: CPI
CPI - M/M change
Prior 0.5 %
Est 0.5 %
Range 0.3 % to 0.5 %
Act 0.5 %
CPI - Y/Y change
2.2 %


2.7 %
CPI less food & energy
0.2 %
0.2 %
0.1 % to 0.2 %
0.1 %
CPI less food & energy - Y/Y change
1.1 %


1.2 %
US: Empire State Index
General Business Conditions Index - Level
17.5 
17.5 
8.0  to 21.1 
21.7 

US: Industrial Production
Production - M/M change
Prev -0.1 %
 Rev 0.1 %
Est 0.6 %
Range 0.4 % to 0.9 %
Act 0.8 %
Capacity Utilization Rate - Level
76.3 %
76.9 %
77.3 %
76.7 % to 77.6 %
77.4 %

Market Activity

Softs+1.56%
CC+4.32% LB+3.43% KC+2.02% SB+0.61% CT-0.27% OJ-0.76%          
 Today was First Notice day for the May Cocoa contract

Indices+0.70% CRB +0.28% VIX -2.48%
EW +0.99% RJ +0.86% ES +0.65% YM+0.61% NQ+0.39%

Energies+0.65%
RB+1.68% CL+1.43% HO+1.10% NG-0.76% Ethanol -0.80%
Financalals+0.53%
US+0.94% TY+0.51% FV+0.40% TU +0.14% ED +0.01%

Metals+0.33%
SI +2.10% GC+0.92% PL-0.04% HG-0.62% PA-0.79%
Currencies+0.07%
MP+0.47% JY+0.36% AD+0.29% USD+0.19% CD unch   SF-0.09% BP-0.28%  EC-0.38%      

Grains-0.08%
SM+0.79% W0.51% O+0.26% S+0.06%BO-0.05% RR-0.22% RS-0.35%Corn-1.62%


Thursday, April 14, 2011

Economic Reports

Producer Price Index


PPI - M/M change
Prior 1.6 %
 Est 1.0 %
Range 0.4 % to 1.6 %
Act 0.7 %
PPI less food & energy - M/M change
0.2 %
0.2 %
0.1 % to 0.4 %
0.3 %

Jobless Claims

New Claims - Level
 Prior 382 K
Revised 385 K
Est 380 K
Range 375 K to 385 K
Act 412 K
4-week Moving Average - Level
389.50 K
390.25 K


395.75 K

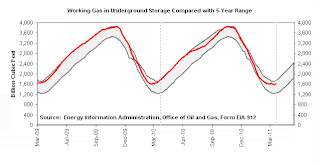
EIA Natural Gas Report  http://ir.eia.gov/ngs/ngs.html
EIA Natural Gas Storage Data
Total (04/08/11): 1,607 Bcf 
Total (04/01/11): 1,579 Bcf 
Change: 28 Bcf 
Year ago stocks: 1,744 Bcf
% diff to yr ago: -7.9 % 
5-year avg stocks: 1,597 Bcf
% dif to 5-yr avg: 0.6 % 


 Market Activity

Metals +1.66%
SI+4.65% GC+1.33% PL+1.20% PA+1.01% HG+0.22%
Energies +0.48
NG+2.03% CL+1.20%  RB unch HO-0.08% Ethanol -0.71%
Currencies+0.34%
MP+0.50% AD+0.47% JY+0.45% BP+0.44% SF+0.39% EC+0.35% CD+0.29% USD-0.39%
Indices+0.22% CRB+0.28 VIX -0.98%
RJ+0.58% YM+0.29% ES+0.15% EW+0.13% NQ-0.19%

Softs-0.08%
CC+1.92% OJ+1.64% KC+0.61% CT-0.66% SB-1.41% LB-2.59%
Financials -0.09%
ED-0.01% TU-0.06% FV-0.20% US-0.21% TY-0.24%

Grains-0.51%
RR+0.29% SM+0.09%  C-0.17% S-0.19%    RS-0.38% BO-0.85% O-1.23% W-1.63%

Wednesday, April 13, 2011

Market Wrap for 4.13.11

Economic Reports
MBA Purchase Applications
Purchase Index - W/W Change
6.7 %
-4.7 %
Refinance Index - W/W Change
-6.2 %
-7.7 %
Composite Index - W/W Change
-2.0 %
-6.7 %

Retail Sales


Prior
Prior Revised
Consensus
Consensus Range
Actual
Retail Sales - M/M change
1.0 %
1.1 %
0.5 %
0.0 % to 1.2 %
0.4 %
Retail Sales less autos - M/M change
0.7 %
1.1 %
0.7 %
0.2 % to 1.8 %
0.8 %

Business Inventories


Prior
Consensus
Consensus Range
Actual
Inventories - M/M change
0.9 %
0.8 %
0.7 % to 1.1 %
0.5 %

EIA Status Report

The Federal Reserve beige Book
Reports from the twelve Federal Reserve Districts indicated that economic activity generally continued to improve since the last report. While many Districts described the improvements as only moderate, most Districts stated that gains were widespread across sectors, and Kansas City described its economic gains as solid”.  (Source: US Federal Reserve)

Market Activity
Energies +0.94%
RB+2.38% NG+0.98% HO+0.95% CL+0.69%  Ethanol -0.08%


I am confused by the discrepancies between the Mastercard gasoline sales figures and the EIA implied demand estimates.

Indices+0.40% CRB 0.15% VIX -1.93%
NQ+0.86% EW+0.49% RJ+0.29% YM+0.14% ES+0.11%

ESM11 has closed below the 50dMA for 2 consecutive days for the 1st time since closing above that line on 03.24.11


Softs +0.36%
LB+4.15% KC+2.10% CC+0.43% OJ-0.24% CT-1.19% SB-3.09%
Financials +0.22%
US+0.39% TY+0.22% FV+0.15% TU+0.04% ED+0.01%
Grains +0.18%
RR+1.91% RS+0.69% C+0.40% S+0.28% BO+0.21% SM-0.06% W-0.89% O-1.09%
Currencies +0.07%
MP +0.48% AD+0.30%       USD+0.14%BP+0.08% SF+0.04% JY-0.08% CD-0.13% EC-0.29%
Metals -0.12%
SI+1.26%  GC +0.21% PL+0.05% -0.86% HG-2.33%
COMEX silver inventories have fallen over 2% from 3.31.11 (See Chart)


Earnings


Before The Open

Actual

Consensus
Yr Ago

Yr/Yr Rev

ASML Holding
ASML
1.30

1.19
0.25


JPMorgan Chase
JPM
1.28

1.16
0.74

-8.5%

After The Close

Actual

Consensus
Yr Ago

Yr/Yr Rev

JB Hunt Trans
JBHT
0.40

0.38
0.29

18.5%

Universal Forest
UFPI
-0.19

0.01
-0.06

-1.5%

Tuesday, April 12, 2011

Economic News
NFIB Small Business Optimism Index

Prior
Actual
level
94.5 
91.9 
Lower sales & weaker outlook. Hiring and hiring outlook both up

ICSC-Goldman Store Sales

Prior
Actual
Store Sales - W/W change
2.3 %
0.1 %
Store Sales - Y/Y
2.8 %
2.9 %


International Trade


Prior
Prior Revised
Consensus
Consensus Range    Actual
Trade Balance Level
$-46.3 B
$-47.0 B
$-44.0 B
$-47.5 B to $-41.9 B
$-45.8 B

Imports in Food & consumer goods both rose.  Auto and capital goods imports fell. Exports fell

Import and Export Prices


Prior
Actual
Export Prices - M/M change
1.2 %
1.5 %
Export Prices - Y/Y change
8.6 %
9.5 %
Import Prices - M/M change
1.4 %
2.7 %
Import Prices - Y/Y change
6.9 %
9.7 %
Import price rise due to 10.5% rise in energy prices


Redbook

Prior
Actual
Store Sales Y/Y change
0.5 %
4.7 %

Treasury Budget


Prior
Consensus
Consensus Range
Actual
Treasury Budget - Level
$-222.5 B
$-189.0 B
$-190.0 B to $-189.0 B
$-188.2 B
The deficit is +15% Outlays +11% Interest cost + 10% Receipts +7%
 Market Activity
Financials +0.49%
US +0.71%     TY+0.58% FV+0.42%TU +0.16% ED unch 

Currencies
JY+1.19% SF +1.08% EC+0.35% USD -0.25% AD -0.40%        BP-0.56% CD -0.58%MP -0.74%

Softs -0.81%  
CC +1.79% KC -0.29% OJ -0.85% LB -1.38% SB -1.77% CT-2.37%

Indices  -0.95%   VIX +0.73% CRB -1.64%
NQ -0.77% ES -0.78% YM -0.93% EW -1.00%        RJ -1.27%

Metals -1.73%
GC -1.04% PL-1.16% SI -1.48% HG -1.79% PA -3.19%

Energies -2.05%
NG -0.17% RB-1.27% Ethanol  -2.56% HO -2.66% CL-3.77%

Grains -2.87%
SM -2.09% RS-2.34% RR -2.55% O -2.62% BO -2.69% S-2.83% C-3.03% W-4.85%
Earnings
Earnings Monday 4;  2 above ests 1 match 1 below; 2 posted higher revs 2 lower revs
Earning Tuesday 2; 1 above 1 below; both posted revs above year-ago

Blog Archive

Disclaimer

The contents of any third-party letters/reports above do not necessarily reflect the opinions or viewpoint of G. Scott Hinton. They are provided for informational/educational purposes only.All sites refered to or displayed on this blog are available to anyone free of charge. The content of any message or post by G. Scott Hinton anywhere on this site is not to be construed as constituting market or investment advice. Such is intended for educational purposes only. Individuals should always consult with their own advisors for specific investment advice. This information is not to be construed as an offer to sell or a solicitation or an offer to buy commodities herein named. The risk of trading futures and options can be substantial.