Friday, March 4, 2011

Economic Data
#1) Employment Situation View Report Here
The unemployment rate has fallen in the last 3 reports
The “real” unemployment rate (U6) has been steady or lower for the last 5 months

___________________Prev____Revised____Est________Range___________Act___
Nonfarm Payrolls - M/M change
36,000 
63,000 
200,000 
120,000  to 275,000 
192,000 
Unemployment Rate - Level
9.0 %

9.1 %
8.9 % to 9.3 %
8.9 %
Average Hourly Earnings - M/M change
0.4 %

0.2 %
0.0 % to 0.2 %
0.0 %
Av Workweek - All Employees
34.2 hrs

34.3 hrs
34.3 hrs to 34.4 hrs
34.2 hrs
Private Payrolls - M/M change
50,000 
68,000 
190,000 
130,000  to 295,000 
222,000 

#2) Factory Orders
Factory Orders - M/M change
Prev 0.2 %
Rev 1.4 %
E 2.0 %
Range  1.0 % to 3.2 %
Act 3.1 %
 
Market Moves
Crude WTI +2.94% Heating Oil +1.31% Gasoline +0.75% Natural Gas +0.66% Ethanol Futures unch

The ongoing Libyan situation and fears that it might spread to other oil producing nations

Silver +3.82% Gold +1.19% Platinum +0.64% Copper +0.04% Palladium -0.36%

Gold posted a record high early in the week and silver is at the highest level since 1980, when it reached a record of over $50/ oz

T-Bond 0.70% 10-Year +0.64% 5-Year +0.53% 2-Year +0.18% Eurodollar unch
Interest rates sold off after the payroll number but rallied after higher energy prices pressed indices lower

SF +0.62% Euro +0.21% Yen +0.03% Can$-0.05% Pound -0.07% U.S.$-0.10% AD $ -0.20%
The Swiss Franc continues to be the best performing currency : 1 mnth=+3.1% 3 mnth +5.46% 1 yr +15.93%


Wheat +1.06% Rice +0.64% Beans +0.14% Oats -1.02% Corn -1.19%

Cotton +3.4% LB +2.05% Cof -0.7% OJ -0.9% Cocoa -2.04% Sug  -2.3%


VIX +2.17% Rus 2K -0.35% NASDAQ -0.5% MidCap -0.64% DJIA -0.69% S&P -0.71%


Thursday, March 3, 2011

03.03.11 Review


Economic Reports
#1) Monster Employment Index
Monster Employment Index
Prev 122 
Act 129 


#2)Weekly Jobs Report (Click Here)
New Claims - Level
Prev 391 K
Revised 388 K
Cons 395 K
Range 388 K to 405 K
Act 368 K
4-week Moving Average - Level
Prev 402.0 K
Revised 401.25 K


Act 388.50 K

#3) Productivity and Costs
Nonfarm productivity - Q/Q change - SAAR
Prev 2.6 %
Est 2.6 %
Range 2.0 % to 3.0 %
Act 2.6 %
Unit labor costs - Q/Q change - SAAR
-0.6 %
-0.3 %
-1.0 % to -0.2 %
-0.6 %
#4) ISM Non-Mfg Index
Composite Index - Level
Prev 59.4 
Est 59.0 
Range 57.8  to 65.1 
Act 59.7 
Weekly Change
-81 bcf
-85 bcf
Summary from the EIA report- Summary
Working gas in storage was 1,745 Bcf as of Friday, February 25, 2011, according to EIA estimates. This represents a net decline of 85 Bcf from the previous week. Stocks were 9 Bcf less than last year at this time and 15 Bcf below the 5-year average of 1,760 Bcf. In the East Region, stocks were 80 Bcf below the 5-year average following net withdrawals of 71 Bcf. Stocks in the Producing Region were 83 Bcf above the 5-year average of 613 Bcf after a net injection of 9 Bcf. Stocks in the West Region were 18 Bcf below the 5-year average after a net drawdown of 23 Bcf. At 1,745 Bcf, total working gas is within the 5-year historical range.
Market Review
Indices +2.07% Softs +1.63% Grains +1.26% Meats +0.96%
FX -0.07% Energies -0.10% Financials -0.62% Metals-1.24%
News that Libyan rebels had regained control of oil facilities and Venezuela had offered to mediate the Libyan conflict sent energies, financial contracts and precious metals lower.
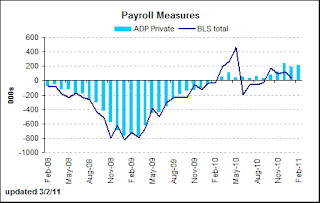
Equities benefitted from lower energy prices and better than expected employment reports. However, it should be noted that in the 2 prior months, the government reported fewer new jobs than what the private forecasts had predicted.
Grains rallied on talk that the Chinese plan to lower import tariffs on certain products, strong export numbers in beans and news that too much rain was slowing the Brazilian soybean harvest
Indications that the ECB may begin to raise rates sooner than expected weighed on gold and interest-rate futures.

Wednesday, March 2, 2011

03.02.11 Review

Economic Reports
#1) MBA Purchase Applications
_________________________Prev________Act
Purchase Index - W/W Change
__5.1 %__
__-6.1 %__
Refinance Index - W/W Change
__17.8 %__
__-6.5 %
Composite Index - W/W Change
__13.2 %__
__-6.5 %__
The housing market remains depressed. These declines in mortgage financing occurred in a week where mortgage rates fell 16 basis points. The average 30 yr fixed rate is 4.84%

#2) Challenger Job-Cut Report 
Announced Layoffs - Level
Prev 38,519 
Act. 50,702 

The bulk of the layoffs were from the government/non profit sector.

#3) ADP Employment Report

ADP employment
Prior =187,000 
Revised=189,000 
Latest=217,000 
#4) EIA Petroleum Inventory Report View Report Here
Crude: -364k 1st decline in 7 weeks
Gasoline: -3.59m. Largest drop since Oct. 10 Demand was up 0.7% despite higher prices at the punp.


#5) FED Beige Book View Beige Book Here
“overall economic activity continues to expand at a moderate pace.” Manufacturing continues to lead the recovery. Retail sales was the next strongest sector. Loan demand was mixed. The labor picture is slowly improving.

Market Activity
Soft commodity sector was the best performing group (+1.32%) The front month contracts in cotton & sugar were the largest percentage gainers. CTH11 +4.4% SBH11 +3.14%
Energies rose 0.75%, on continued uncertainty about the situations in the MidEast and a bullish inventory report. Front month WTI crude gained 2.75%
Equity indexes posted a 0.92% gain. The improving jobs picture outweighed higher oil prices. The VIH11 (VIX) contract remains below its 50d moving average
The metals complex was up 0.2%, with GCJ11 posting a new record high.
Interest rate contracts posted the largest declines, with the financial sector falling 0.32% today.


Tuesday, March 1, 2011

03.01.11 Review

Economic Data
#1) Weekly Retail Sales
ICSC-Goldman Store Sales
____________________________Prior___________Actual
Store Sales - W/W change
2.6 %
-0.5 %
Store Sales - Y/Y
3.0 %
3.3 %
Redbook
Store Sales Y/Y change
2.7 %
3.0 %


#2) ISM Mfg Index
_____________Prior__Est___Range___Actual
ISM Mfg Index - Level
60.8 
60.5 
58.7  to 62.0 
61.4 

#3) Construction Spending
__________________Prior___Rev_____Est____Range______Actual
Construction Spending - M/M change
-2.5 %
-1.6 %
-0.8 %
-1.0 % to -0.3 %
-0.7 %
Construction Spending - Y/Y change
-6.4 %
-5.3 %


-5.9 %
Market Activity
Energies and metals were sharply higher as US military forces repositioned themselves closer to Libya. GCJ11 rose 1.7% to a record high. Silver was up 2.5%, with platinum & palladium up over 1.8%. 
GCJ11


In the energy complex: RBJ11 was up 3.7%, HOJ11 up 3.5% and CLJ11 up 3.25%. Brent crude was up almost 4.0%
As the PLATTS Oil Blog notes, although gasoline prices are almost 20% above year-ago levels demand is up 2.6% from last year.


These higher energy prices are weighing on equities, with the S&P falling 1.75% and the NASDAQ and Dow off about 1.5%. The March VIX contract rose 9.3% and flirting with its 50 day moving average

VIXH11
.


Monday, February 28, 2011

Overnight News for Trade Date 03.01.11

Australia : Retail Sales  
__________Prior___Consensus___ Actual 
 M / M ____0.2 % _____0.7 % ____0.4 % 
 Y / Y_____ 2.1 % _____________1.8 %


Australia : RBA Announcement
  _______Prior___ Consensus___ Actual 
 Change__ 0 bp ____0 bp _______0 bp 
 Level___ 4.75 %__ 4.75 % ____4.75 %


Japan : Household Spending
 _____ Prior___ Consensus ___Actual 
 Y/Y__ -3.3 % ____-0.5 % ___-1.0 %


Japan : Unemployment Rate
  _____Prior___ Consensus Actual 
 Level__ 4.9 %___ 5.0 %___ 4.9 %


China : PMI Manufacturing Index
____  Prior ___Consensus__ Actual 
 level __54.5 ___ 51.5 ______ 51.7 

The metals and the softs were the biggest movers today. The metals segment was up 1.1%, with most of that movement coming from silver, which rose 2.7%. COMEX silver inventories remain tight Click to see COMEX Silver Stocks and today was 1st notice day lfor the March contract'
The softs complex was up over 2.0% with March cotton ending the day over 7.0% higher and March sugar was up over 3.0% on its last day of trading. As we noted earlier, Chinese benchmark Cotton rose 7.0% (the daily limit) after China's National Bureau of Statistics reported that cotton out fell over 6.25% in 2010.
As you can see from the 25 year chart, NY cotton has risen sharply  over the last 6 months.

This NOAA link outlines some of the fundamental reasons for the recent strength in the Ag sector.
There were adverse growing conditions in Russia, Brazil, Pakistan, China and Australia that propelled cotton prices to record levels,
NOAA Top 10 Climate Events for 20010


 Economic Data

#1) Personal Income & Spending
________________________

Prior
Prior Revised
Consensus
Consensus Range
Actual
Personal Income - M/M chg
0.4 %

0.4 %
0.2 % to 1.2 %
1.0 %
Personal Income - Yr/Yr chg
3.8 %


4.6 %


________________________

Prior
Prior Revised
Consensus
Consensus Range
Actual
Consumer Spending- M/M chg
0.7 %
0.5 %
0.4 %
0.3 % to 0.5 %
0.2 %
Consumer Spending - Yr/Yr chg
4.1 %
3.9 %


4.0 %


#2) Chicago PMI
________________________
Prior
Consensus
Consensus Range
Actual
Business Barometer Index - Level
68.8 
68.0 
66.8  to 70.3 
71.2 


#3) Pending Home Sales
___________________________
Prior
Prior Revised
Actual
Pending Home Sales Index - Level
93.7 

88.9 
Pending Home Sales Index - M/M
2.0 %
91.5 %
-2.8 %


Blog Archive

Disclaimer

The contents of any third-party letters/reports above do not necessarily reflect the opinions or viewpoint of G. Scott Hinton. They are provided for informational/educational purposes only.All sites refered to or displayed on this blog are available to anyone free of charge. The content of any message or post by G. Scott Hinton anywhere on this site is not to be construed as constituting market or investment advice. Such is intended for educational purposes only. Individuals should always consult with their own advisors for specific investment advice. This information is not to be construed as an offer to sell or a solicitation or an offer to buy commodities herein named. The risk of trading futures and options can be substantial.