Friday, March 11, 2011

03.11.11 Final Report

Price Movements

Silver +2.48% Platinum +0.91% Gold +0.66%  Copper +0.24% Palladium -0.12%
Safe haven buying resurfaced in the PMG and copper saw some technical short covering.

Mini Nasdaq +0.97%  Mini S&P +0.91% Midcap DJIA Mini-+0.68%  Russell Mini +0.43%
Oil refiners and material companies rose on the theory that these sectors will benefit Japanese efforts to rebuild after Friday’s 8.9 earthquake .
AD+1.42% JY +1.39% EC +0.68% MP+0.48$ SF+0.27% CD+0.25% BP+0.14% USD -0.65%

5-Year +0.07% 10-Year +0.05% 2-Year +0.04% E$+0.01% T-Bond -0.03%

CT +1.97% Sugar #11 +0.52%  Cocoa -0.96% OJ-1.35% Coffee -2.19%

NG +1.54% HOil -0.52% RBOB -1.06%  WTI -1.50% Ethanol -2.31%
Natural gas remains in a tight range. The petroleum complex sold off on worries the earthquake may weaken the global recovery and weaken demand.

Rice -0.31% Meal -1.05% Oats -1.54% Beans -1.55% B Oil -1.81% Corn -2.71%  Wheat -2.94%
Grain sold off on worries about damage to Japanese ports and its effect on grain shipments. Japan is a major buyer of US bean, corn, rice and wheat.

Economic News


China: CPI
Y/Y % Change Prior 4.9 % Est 4.8 Act 4.9
Food prices +11.0% Non-food +2.3%

China: Industrial Production
 Yr/Yr % change Prior 13.5 % Est 13.1 % Act 14.9 %

China: PPI
Y/Y % Change Prior 6.6 % Est 7.0 Act 7.2
M /M % change was +0.8% vs +0.9% prev

China: Retail Sales
Y/Y % Change Prior 19.1 Est 19.0 Act 11.6
Well below expectations


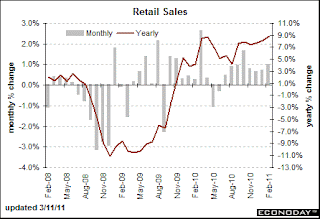
US Retail Sales


Retail Sales- M/M change Prev 0.3 % Rev 0.7 % Est 1.0 % Range 0.1 % to 1.5 % Act 1.0 %
less autos- M/M change  Prev 0.3 % Rev 0.6 % Est 0.7 % Range 0.3 % to 1.3 % Act 0.7 %

Auto sales and higher energy prices accounted for much of the gain


US Consumer Confidence

Sentiment Index - Level Prior 77.5 Rev 76.5 Range 74.8 to 80.0 Act 68.2

Increasing oil prices are beginning to cause concern with consumers. The normally stable inflation expectation component jumped to 4.6% one year out. And the five year out reading is now at 3.2%


US Business Inventories

Inventories - M/M change Prior 0.8 % Est 0.8 % Range 0.6 % to 0.9 % Act 0.9 %


Thursday, March 10, 2011

03.10.11 Review

Economic Reports


China : Merchandise Trade Balance
level Prior $6.45 B Est $4.5 B Act $-7.3 B
Imports were up 19.4% while exports rose 2.4%. 5th straight month that imports grew more than exports. (The Chinese New Year Holiday may have affected exports more than imports.)


United States : International Trade

Trade Balance Level Prior $-40.6 B Revised $-40.3 B Range $-42.2 B to $-39.7 B Act $-46.3 B


Weekly Jobless Claims  (Click to view report)


New Claims - Level Prior 368 K Revised 371 K Est 385 K Range 370 K to 400 K Act 397 K
4-week Moving Average - Level Prior 388.50 K Revised 389.25 K Act 392.25 K

EIA Natural Gas Report (Click to view EIA Report)

Weekly Change -85 bcf -71 bcf
Analysts were looking for a 80bcf draw

Other News Items
 USDA International Weather Summary
North America
Of particular concern was winter wheat on the central and southern High Plains, which—in addition to the February temperature swings—has been adversely affected by drought. In contrast, snow continued to accumulate across the northern Plains and upper Midwest, increasing the likelihood of spring flooding

South America
In Brazil, weather conditions remained generally favorable for soybeans and other summer row crops, as well as coffee, sugarcane, and citrus.

Russia
Near- to below-normal precipitation was observed in most primary winter crop areas, although wetter-than-normal weather (mostly snow) prevailed in western portions of Ukraine and Belarus.

India
February warmth in India aided the development of wheat and rapeseed, previously slowed by cold conditions. Late-month showers provided favorable
moisture for winter crops entering reproduction.

China
Light rainfall late in February eased short-term dryness across winter crop areas of China and provided beneficial moisture for wheat and rapeseed breaking dormancy

Australia
In February, occasional showers throughout most of southern Queensland and northern New South Wales maintained abundant moisture supplies for reproductive summer crops.

South Africa
In February, drier-than-normal weather reduced moisture levels for filling corn in eastern sections of the corn belt. Drier conditions also prevailed in sugarcane areas of KwaZulu-Natal, but scattered showers were overall beneficial for summer crops in western sections of the corn belt.

USDA WASDE Report

La NiƱa update

Platts press release on OPEC Feb Production Increase

Comex Silver Inventories up 500,000

Wednesday, March 9, 2011

Silver Report

Market Performance
_____
LAST
YTD %
3-MTH 
6-MTH 
9 MTH 
1 YR

SI
35.955
+15.81%
+25.25%
+80.17%
+93.83%
+109.39%

GC
1,429.1
+0.28%
+2.93%
+14.24%
+15.98%
+27.91%

PL
1,802.0
+1.00%
+6.90%
+15.81%
+16.30%
+12.93%

CT
206.78
+48.54%
+59.45%
+130.32%
+157.83%
+166.99%


Because of its role as both an industrial material and an investment vehicle,
Silver continues to be the best performer in the metals complex. Only cotton, because of weather related issues, has posted better returns.
There are a couple of theories floating around that attempt to explain this move.

The "Short Squeeze":

CFTC Bank Participation Reports As you see in these reports, as of 03.01.11

banks were were net short approximately 30,000 silver futures contracts. The option reports shows that banks were holding bearish options positions: short calls and long puts.
The shortsqueeze.com link shows the SLV ETF has a short interest position of 17,631,300 shares.


Dwindling Stocks:
COMEX Silver Inventories at a 5 year low
The backwardation structure of the price curve shows how tight silver supplies are.


Market Manipulation:
CFTC Manipulation Investigations


Supply/Demand discussion from Silverseek.com


03.09.11 Review

Economic Indicators
MBA Purchase Applications     
__________________Prior_______Act
Purchase Index - W/W Change
-6.1 %
12.5 %
Refinance Index - W/W Change
-6.5 %
17.2 %
Composite Index - W/W Change
-6.5 %
15.5 %

Wholesale Trade
Inventories - M/M change
Prior
1.0 %
Revised 1.3 %
Act
1.1 %

EIA Petroleum Status Report
Crude Inventories:  Prior-0.4m Bbl Est+1.3m Bbl Act + 2.5m Bbl
Gasoline : Est -1.5m Bbl Act -5.5m Bbl 3rd drop in a row
Distillate : Est –o.5m Bbl Act -4.0m Bbl 4th straight draw


Summary:
EIA expects continued tightening of world oil markets over the next two years
The forecast for total world oil consumption grows by an annual average of 1.6 million bbl/d through 2012.
Projected WTI spot prices rise to an average of $105 per barrel in December 2011 and remain at about that level through 2012.

Market Movers
 RBOB +2.50% Heating Oil +1.84% Natural Gas +1.45%  Crude Oil WTI -0.97%
T-Bond +0.69% 10-Year Note +0.46% 5-Year Note +0.30% 2-Year Note +0.08% 3M ED unch
S Franc +0.64% Can Dollar +0.28% Euro FX +0.02% J Yen -0.07% U.S. Dollar Index -0.10%
DJIA Mini  +0.07% Mini S&P unch Mini Nasdaq 100 -0.50%
Silver +1.32% Gold +0.15% Platinum +0.11% Palladium -0.74% High Grade Copper -3.19%
Coffee +2.66% Sugar #11 -0.91% Cotton #2 -1.32%  Lumber -1.86% Cocoa -2.92%
Corn -0.64% Bean Meal -2.08% Bean Oil -2.33% Beans -2.39% Wheat -2.69%


Tuesday, March 8, 2011

03.08.11 Market Recap

Economic Reports
  1. Small Business Optimism Index
    level
    Prior 94.1 
    Latest 94.5 
  2. Goldman Sales
    Store Sales - W/W change
    Prior -0.5 %
    Latest 2.3 %
    Store Sales - Y/Y
    Prior 3.3 %
    Latest2.6 %
  3. Redbook Sales
    Store Sales Y/Y change
    Prior 3.0 %
    Latest 2.0 %
Market Activity
As of 2pm CST
Russell 2000  +1.79% Mini Midcap +1.45% Dow Mini+1.16% ES +0.95% Mini NQ +0.67%
SB #11 +2.83% KC +2.29% OJ +1.35% LB -0.37% CC -0.79% CT #2 -3.27%
HG +0.39% PA unch GC -0.32% SI -0.60%  PL -0.92%
Crude WTI -0.47%  Nat Gas -1.55% Gasoline -1.86% H Oil -1.87%
Meal -0.83% Beans -0.93% Bean Oil -1.05% Corn -1.67% Wheat -2.62% 

Talk that OPEC may hold an emergency meeting to discuss increasing production had a ripple effect over equities, energies and metals.
The wild ride in cotton continues with US markets following the price action of the Chinese market, which fell over 6.0% overnight. Traders also noted the divergence of the RSI indicator as the market posted new highs the indicator has lagged.
Source:Barchart.com

Monday, March 7, 2011

03.07.11 Review


Economic Reports


______________________
Prior
Prior Revised
Consensus
Consensus Range
Actual
Consumer Credit - M/M change
$6.1 B
$4.1 B
$2.5 B
$-2.0 B to $5.0 B
$5.0 B
Strong auto sales were responsible for most of the increase. Credit-card debt fell 6.4%, to the lowest level since September 2004. The level has declined in 28 times in the last 29 reports.


Blog Archive

Disclaimer

The contents of any third-party letters/reports above do not necessarily reflect the opinions or viewpoint of G. Scott Hinton. They are provided for informational/educational purposes only.All sites refered to or displayed on this blog are available to anyone free of charge. The content of any message or post by G. Scott Hinton anywhere on this site is not to be construed as constituting market or investment advice. Such is intended for educational purposes only. Individuals should always consult with their own advisors for specific investment advice. This information is not to be construed as an offer to sell or a solicitation or an offer to buy commodities herein named. The risk of trading futures and options can be substantial.