Saturday, December 4, 2010

November 2010 Jobs Situation

                                               Prior     Consensus         Consensus Range           Actual
Nonfarm Payrolls - M/M change  151,000   168,000           100,000 to 200,000     39,000
Private Payrolls - M/M change    159,000                                                            50,000
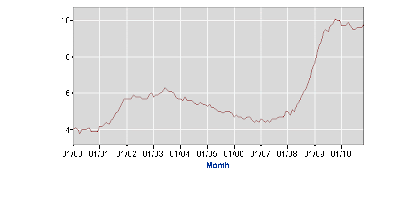
Unemployment Rate - Level       9.6 %       9.7 %             9.5 % to 9.7 %             9.8 %
Avg Hourly Earnings -M/M chng 0.2 %       0.2 %            0.1 % to 0.2 %                 0.0 %
Av Workweek - All Employees 34.3 hrs   34.3 hrs           34.3 hrs to 34.3 hrs       34.3 hrs
(Source:Econoday)


Unemployment=9.8%  up 0.2%
 Second highest reading this calendar year.


Unemployemnt Rate for workers over 25yo w/ degree= 5.1%

New high. Largest move since 0.4% increase from 11/08 to 12/08.  


Discouraged Workers(in thousands)= 1,282

Workers who feel that there are no jobs jumps 5.0% to a new high


"Real Unemployment Rate=17%


Thursday, December 2, 2010

Econoday Report: Pending Home Sales Index December 2, 2010

Econoday Report: Pending Home Sales Index December 2, 2010: "Pending Home Sales Index
Released on 12/2/2010 10:00:00 AM For Oct, 2010
PriorActual
Pending Home Sales Index - Level80.9 89.3
Pending Home Sales Index - M/M-1.8 %10.4 %


Highlights
In badly needed good news on the housing sector, the pending home sales index jumped 10.4 percent in October to indicate gains ahead for existing home sales. The index at 89.3 is up 18 percent from its post-stimulus low in June. Low home prices and low rates appear to be stimulating demand.

October gains were concentrated in the Midwest and Northeast though the South showed a solid gain. The West was little changed. This is forward-looking data as is the weekly Mortgage Bankers purchase index which has been on a solid upswing"

Monday, November 29, 2010

Gold Head and Shoulders Update


Back in July of 2009 I sent out this weekly gold chart via a Bloomberg terminal. At the time I commented that if spot bullion could break the $1000.00 level and hold those gains, the technical price objective would be around $1350.00. 
I did not know there would be a QE1 or a QE2 or that sovereign nations would be teetering on financial collapse, but that is the "magic" of technical analysis. If you use proper money management, the market often signals where prices are going.

I am not saying that this is the top, all the ingredients that got the market here are still if place, but it seems like the momentum play has lost it's steam. This might prove to be a "buy the rumor...sell the fact" scenario.

Governments are beginning to take the steps needed to get their finances in order.
And the "gold story" has been well documented in the press and "buy gold" ads are constantly aired on AM radio. So where is the new buying going to come from?


The daily gold chart posted below warrants some attention. If the gold market breaks below the "neckline" ($1340.00) gold could easily fall to the $1200.00 to $1250.00 price range.


Blog Archive

Disclaimer

The contents of any third-party letters/reports above do not necessarily reflect the opinions or viewpoint of G. Scott Hinton. They are provided for informational/educational purposes only.All sites refered to or displayed on this blog are available to anyone free of charge. The content of any message or post by G. Scott Hinton anywhere on this site is not to be construed as constituting market or investment advice. Such is intended for educational purposes only. Individuals should always consult with their own advisors for specific investment advice. This information is not to be construed as an offer to sell or a solicitation or an offer to buy commodities herein named. The risk of trading futures and options can be substantial.