Showing posts with label cocoa. Show all posts

Friday, April 15, 2011

04.15.11 Market Wrap

Economic Data
CN:Consumer Price Index

Prior
Consensus
Actual
M/M % Change


-0.2 
Y/Y % Change
4.9 
5.2 
5.4 
 CN:GDP
Y/Y % Change
9.8 
9.6 
9.7 

CN:Industrial Production
Yr/Yr % change                    14.9 %                      14.0 %              14.4 %

CN:Producer Price Index
M/M % Change


0.6 
Y/Y % Change
7.2 
7.2 
7.3 
CN:Retail Sales 
M/M % Change


1.3 
Y/Y % Change
11.6 
16.5 
17.4 

US: CPI
CPI - M/M change
Prior 0.5 %
Est 0.5 %
Range 0.3 % to 0.5 %
Act 0.5 %
CPI - Y/Y change
2.2 %


2.7 %
CPI less food & energy
0.2 %
0.2 %
0.1 % to 0.2 %
0.1 %
CPI less food & energy - Y/Y change
1.1 %


1.2 %
US: Empire State Index
General Business Conditions Index - Level
17.5 
17.5 
8.0  to 21.1 
21.7 

US: Industrial Production
Production - M/M change
Prev -0.1 %
 Rev 0.1 %
Est 0.6 %
Range 0.4 % to 0.9 %
Act 0.8 %
Capacity Utilization Rate - Level
76.3 %
76.9 %
77.3 %
76.7 % to 77.6 %
77.4 %

Market Activity

Softs+1.56%
CC+4.32% LB+3.43% KC+2.02% SB+0.61% CT-0.27% OJ-0.76%          
 Today was First Notice day for the May Cocoa contract

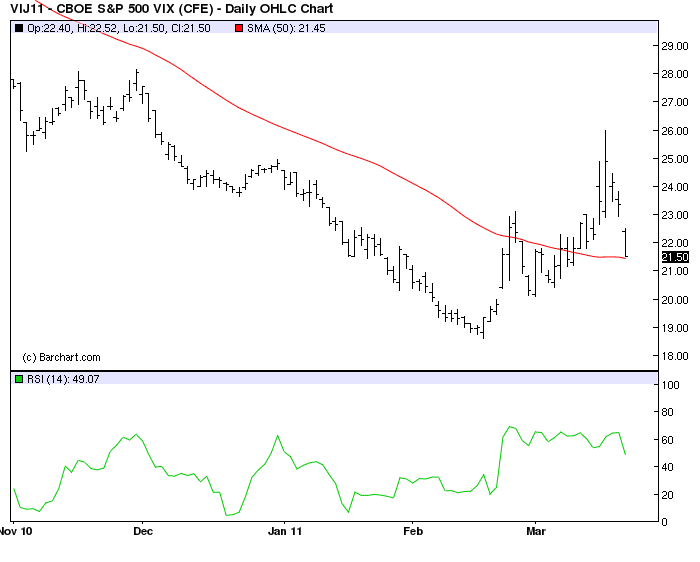
Indices+0.70% CRB +0.28% VIX -2.48%
EW +0.99% RJ +0.86% ES +0.65% YM+0.61% NQ+0.39%

Energies+0.65%
RB+1.68% CL+1.43% HO+1.10% NG-0.76% Ethanol -0.80%
Financalals+0.53%
US+0.94% TY+0.51% FV+0.40% TU +0.14% ED +0.01%

Metals+0.33%
SI +2.10% GC+0.92% PL-0.04% HG-0.62% PA-0.79%
Currencies+0.07%
MP+0.47% JY+0.36% AD+0.29% USD+0.19% CD unch   SF-0.09% BP-0.28%  EC-0.38%      

Grains-0.08%
SM+0.79% W0.51% O+0.26% S+0.06%BO-0.05% RR-0.22% RS-0.35%Corn-1.62%


Monday, March 21, 2011

03.21.11 Wrap

Economic Data

Existing Home Sales Existing Home Sales - Level - SAAR
Prior 5.36 M
Revised 5.40 M
Est 5.150 M
Range 5.000 M to 5.230 M
Actual 4.88 M
Existing Home Sales - M/M Change
2.7 %
3.4 %


-9.6 %
Existing Home Sales - Yr/Yr Change
5.3 %


-2.8 %
Home sales  fell 10% last month and are down 2.8% y-o-y. Both single-family and condo sales declined. Existing Home sales peaked in 2005. Distressed sales were 39% of sales transaction. 33% of sales were cash transactions.. In February, the median price fell 1.1% to $156k. 


Market Activity
Indices +1.70%  Story from Reuters
Midcap +1.97%  Russell 2K +1.96% NQ +1.78% ES+1.43% Mini Dow +1.40% VIX -7.49%     

Metals  +1.13%
SI +3.04% PA +2.02% PL +1.31% GC +0.82% HG -1.23% 
                      
Energies +0.68%
RB +1.58% CL +1.22% HO +0.99% Ethanol +0.04% NG -0.31% 

Currencies +0.35%
AD +0.94% CD +0.79% MP +0.70%               BP+0.60% EC +0.49% JY-0.14% SF -0.38% USD -0.41%

Grains +0.20%
RR +1.47% C+0.44% BO +0.20% S +0.04% W-0.28% SM -0.41% O -0.57%

Financials -0.25%       
ED -0.01% TU -0.09% US -0.23%     FV -0.35%      TY-0.41%

Softs -0.32%
CC +1.98%     KC +0.29%     LB unch CT -0.08%    SB -0.83%       OJ -3.30%

Charts
 

Saturday, February 19, 2011

Commodity Movements.

#1) Silver

Silver is trading its highest level in 30+ years.
Rumors of a short squeeze Click Here
COMEX Silver stocksat 5yr low. Click Here


#2) Coffee                                           

Coffee inventories are at the lowest level since 2000
The International Coffee Organization says global supplies will be around 13million bags, the lowest on record.
Demand remains strong. In the past 12 months Starbucks shares have risen 45% and Green Mountain Coffee shares ar up 47%


#3) Cotton
Monthly Cotton


A combination of increasing global demand and adverse weather conditions are the main factors


1 year Cotton w/ 200d MA
CTH11 was limit-up Wednesday & Thursday before ending the week limit-down on Friday. A cotton advisory service released its 1st estimate of the season and said they see output up 13%, with a 4% increase in consumption


#4) Cocoa
Ongoing unrest in  Cote-d'Ivoire and strong demand has cocoa prices at a 32 year high. 


Related Charts
#5) CRB Index


#6) Dollar Index


Financial Futures COT Report Click Here

Commodity Futures COT Report Click Here

Sunday, February 6, 2011

CFTC January '11 This Month in Futures Markets (Click to View)


The CFTC’s January ’11 addition of “This Month in Futures Markets” shows that 16 of the 22 contracts followed followed by the CFTC had increases in open interest.  

 
The largest OI gain was in the  Euro-FX contract which expanded by 18% as the ECH11 rose 3.5% for the month


Gold saw the largest decrease in open interest with an 8.4% drop in outstanding positions, as gold prices fell 6.2% in the month.

Disclaimer

The contents of any third-party letters/reports above do not necessarily reflect the opinions or viewpoint of G. Scott Hinton. They are provided for informational/educational purposes only.All sites refered to or displayed on this blog are available to anyone free of charge. The content of any message or post by G. Scott Hinton anywhere on this site is not to be construed as constituting market or investment advice. Such is intended for educational purposes only. Individuals should always consult with their own advisors for specific investment advice. This information is not to be construed as an offer to sell or a solicitation or an offer to buy commodities herein named. The risk of trading futures and options can be substantial.