Economic Reports
Producer Price Index
PPI - M/M change | Prior 1.6 % | Est 1.0 % | Range 0.4 % to 1.6 % | Act 0.7 % |
PPI less food & energy - M/M change | 0.2 % | 0.2 % | 0.1 % to 0.4 % | 0.3 % |
Jobless Claims
New Claims - Level | Prior 382 K | Revised 385 K | Est 380 K | Range 375 K to 385 K | Act 412 K |
4-week Moving Average - Level | 389.50 K | 390.25 K | 395.75 K |
EIA Natural Gas Report
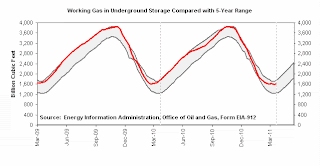
EIA Natural Gas Storage Data
Total (04/08/11): 1,607 Bcf
Total (04/01/11): 1,579 Bcf
Change: 28 Bcf
Year ago stocks: 1,744 Bcf
% diff to yr ago: -7.9 %
5-year avg stocks: 1,597 Bcf
% dif to 5-yr avg: 0.6 %
Metals +1.66%
SI+4.65% GC+1.33% PL+1.20% PA+1.01% HG+0.22%
Energies +0.48
NG+2.03% CL+1.20% RB unch HO-0.08% Ethanol -0.71%
Currencies+0.34%
MP+0.50% AD+0.47% JY+0.45% BP+0.44% SF+0.39% EC+0.35% CD+0.29% USD-0.39%
Indices+0.22% CRB+0.28 VIX -0.98%
RJ+0.58% YM+0.29% ES+0.15% EW+0.13% NQ-0.19%
Softs-0.08%
CC+1.92% OJ+1.64% KC+0.61% CT-0.66% SB-1.41% LB-2.59%
Financials -0.09%
ED-0.01% TU-0.06% FV-0.20% US-0.21% TY-0.24%
Grains-0.51%
RR+0.29% SM+0.09% C-0.17% S-0.19% RS-0.38% BO-0.85% O-1.23% W-1.63%


No comments:
Post a Comment