Thursday, December 30, 2010

Economic Highlights

 Weekly Jobs Report (Click to access report)

Initial Claims Prior=420k Est=416k Act=388k
Continuing Prior+ 4064k Est=4060k Act=4128K


 Initial claims came in better than expected. Some analyst feel that employers refrained  from laying off workers due to the holidays.


Chicago PMI
Chicago PMI Prior=62.5 Est=61.5 Act+68.6*
*Highest reading since 1988


Weekly Natural Gas Storage Report (Click to access report)


EIA Weekly Petroleum Report (Click to access report)

Tuesday, December 28, 2010

Charts for 12.28.10


Record high in CRB Index
 

Record high NY Silver

Record high in NY Copper

Unexpected decline in Consumer Confidence


Larger than expected decline in housing prices

Economic Data for 12.27.10

Commodity COT as of 12.21.10  (click to access reports)
Financial Futures COT as of 12.21.10 (click to access reports)


Trading Comment:
Market activity was fairly subdued as many trading desks were operating with reduced staffing due to holidays and a major snowstorm in the northeast. The most important economic event was the 0.25% rate increase by the Chinese central bank.

Thursday, December 23, 2010

Economic Data for 12.23.10

Durable Goods Orders
Released on 12/23/2010 8:30:00 AM For Nov, 2010


 Personal Income and Outlays


Released on 12/23/2010 8:30:00 AM For Nov, 2010
                                                   Prior   Prior Revised     Consensus      Range           Actual
Personal Income - M/M change   0.5 %        0.4 %               0.2 %   0.1 % to 0.3 %   0.3 %
Personal Income - Yr/Yr change  4.1 %                                 .9 %                             3.8 %
           Spending - M/M change   0.4 %         0.7 %              0.5 %    0.4 % to 0.8 %  0.4 %
          Spending - Yr/Yr change   3.6 %                                3.7 %                            3.8 %
Core PCE price index-M/M chg     0.0 %         0.0 %              0.1 %     0.1 % to 0.2 % 0.1 %
Core PCE price index-Yr/Yr chag  0.9 %                                 0.8 %                            0.8 %

Weekly Jobs Report (click to access Dept of Labor  Site0
Jobless Claims
Released on 12/23/2010 8:30:00 AM For wk12/18, 2010


                              Prior    Revised   Consensus      Range             Actual
New Claims - Level   420 K     423 K       420 K        400kto 425 K     420 K
4-week ma Level   422.75 K   423.5 K                                           426.0 K


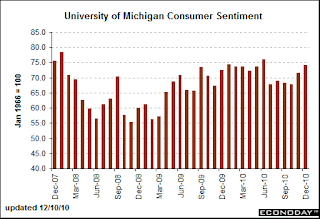
Consumer SentimentReleased on 12/23/2010 9:55:00 AM For Dec, 2010
                                     
                                       Prior  Consensus      Range          Actual
Sentiment Index - Level   74.2       75.0        73.0 to 76.0    74.5

New Home Sales
Released on 12/23/2010 10:00:00 AM For Nov, 2010
                                      Prior        Revised   Consensus    Range              Actual
New Home Sales - SAAR    283K       275 K         300 K    290 K to 320 K   290 K


EIA Nat Gas Report (click to view EIA website)


Tuesday, December 21, 2010

Mareket Recap for 12.21.2010

Weekly CRB chart (Source Barchart.com)
The rally in the commodity sector continues: The CRB rose to the highest level in 27 months.


Monthly Cotton Chart (Source: Barchart)
Cotton trading was locked "limit up" for the 2nd day as cotton prices moved sharply higher
on continued worries about the supply/demand picture for cotton. Chinese demand remains strong while production from Pakistan, the world's third largest producer remains constrained after the flooding earlier this year.


Monthly NY Copper chart (Source: Barchart.com)

Copper prices set records on exchanges in London and New York on renewed Chinese buying and word that the operator of the worlds third largest copper mine had declared "force majeure" on copper shipment obligations.  With demand outpacing supplies, analysts are calling for further price increases in 2011. Commodity fund buying and talk of new copper backed ETF products also underpinned prices in the red metal.

ICSC-Goldman Store Sales Released on 12/21/2010 7:45:00 AM For wk12/18, 2010
                                            Prior               Actual
Store Sales - W/W change     0.8 %              1.7 %
Store Sales - Y/Y                   3.1 %              4.2 %

Redbook Released on 12/21/2010 8:55:00 AM For wk12/18, 2010
                                       Prior        Actual
Store Sales Y/Y change       2.5 %    3.8 %

Retail Sales Data (Click for website.)

Tuesday, December 14, 2010

Economic Data for 12.14.10

NFIB Small Business Index (click to view release)
93.28 vs 91.7 prior. *3 year high


ICSC Goldman Store Sales
w/w +0.8% vs -2.1% prior
y/y +3.1% vs +2.6% year-ago

PPI
 PPI m/m +0.8% vs +0.4%p
       y/y  +3.5%
Less F & E m/m 0.3% vs -0.6% prior
               y/y +1.3%


 Retail Sales
m/m +0.8% vs +1.2% prior
less autos +1.2% s 0.4

Redbook
+2.5% vs +3.8% prior

Business Inventories


FOMC Minutes (click to view release)

Friday, December 10, 2010

Economic Data for 12.10.10

Balance of Trade$-36.7B vs $-44.0Bc $-44.0Bp

Export:m/m +1.5 vs +0.8p y/y +6.5 vs +5.8
Import:m/m +1.3 vs +0.9p y/y +3.7 vs +3.6p

+74.2 vs 72 Est  71.6p


Committment of Traders Reports

Thursday, December 9, 2010

Weekly Natural Gas Storage Report

Weekly Natural Gas Storage Report

EIA Natural Gas Storage Data


Total (12/03/10):     Total (11/26/10):
3,725 Bcf                   3,814 Bcf           Change: -89 Bcf
Year ago stocks: 3,782 Bcf  % diff to yr ago: -1.5 %
5-year avg stocks: 3,393 Bcf   % dif to 5-yr avg: 9.8 %


Weekly Export Sales Report

Corn and soybean exports were inline with trader's estimates, while wheat exports were stronger than expected. Traders are postitioning themselves before Friday's supply and demand report.


Market Research From CMEGroup Website
Market Research from CMEgroup.com

Wednesday, December 8, 2010

CFTC "This Month in Futures 11.10

CFTC

The thing that struck me first was the collapse of open interest in most market segaments. Looking at  "futures" statistics only equities and live stock showed an increase in participation.

EIA Oil Inventory Report

Petroleum Supply Report for the Week Ending 12.03.10


Saturday, December 4, 2010

November 2010 Jobs Situation

                                               Prior     Consensus         Consensus Range           Actual
Nonfarm Payrolls - M/M change  151,000   168,000           100,000 to 200,000     39,000
Private Payrolls - M/M change    159,000                                                            50,000
Unemployment Rate - Level       9.6 %       9.7 %             9.5 % to 9.7 %             9.8 %
Avg Hourly Earnings -M/M chng 0.2 %       0.2 %            0.1 % to 0.2 %                 0.0 %
Av Workweek - All Employees 34.3 hrs   34.3 hrs           34.3 hrs to 34.3 hrs       34.3 hrs
(Source:Econoday)


Unemployment=9.8%  up 0.2%
 Second highest reading this calendar year.


Unemployemnt Rate for workers over 25yo w/ degree= 5.1%

New high. Largest move since 0.4% increase from 11/08 to 12/08.  


Discouraged Workers(in thousands)= 1,282

Workers who feel that there are no jobs jumps 5.0% to a new high


"Real Unemployment Rate=17%


Thursday, December 2, 2010

Econoday Report: Pending Home Sales Index December 2, 2010

Econoday Report: Pending Home Sales Index December 2, 2010: "Pending Home Sales Index
Released on 12/2/2010 10:00:00 AM For Oct, 2010
PriorActual
Pending Home Sales Index - Level80.9 89.3
Pending Home Sales Index - M/M-1.8 %10.4 %


Highlights
In badly needed good news on the housing sector, the pending home sales index jumped 10.4 percent in October to indicate gains ahead for existing home sales. The index at 89.3 is up 18 percent from its post-stimulus low in June. Low home prices and low rates appear to be stimulating demand.

October gains were concentrated in the Midwest and Northeast though the South showed a solid gain. The West was little changed. This is forward-looking data as is the weekly Mortgage Bankers purchase index which has been on a solid upswing"

Monday, November 29, 2010

Gold Head and Shoulders Update


Back in July of 2009 I sent out this weekly gold chart via a Bloomberg terminal. At the time I commented that if spot bullion could break the $1000.00 level and hold those gains, the technical price objective would be around $1350.00. 
I did not know there would be a QE1 or a QE2 or that sovereign nations would be teetering on financial collapse, but that is the "magic" of technical analysis. If you use proper money management, the market often signals where prices are going.

I am not saying that this is the top, all the ingredients that got the market here are still if place, but it seems like the momentum play has lost it's steam. This might prove to be a "buy the rumor...sell the fact" scenario.

Governments are beginning to take the steps needed to get their finances in order.
And the "gold story" has been well documented in the press and "buy gold" ads are constantly aired on AM radio. So where is the new buying going to come from?


The daily gold chart posted below warrants some attention. If the gold market breaks below the "neckline" ($1340.00) gold could easily fall to the $1200.00 to $1250.00 price range.


Wednesday, November 17, 2010

Economic Snapshot for 11.17.10

MBA Purchase Applications

Released on 11/17/2010 7:00:00 AM For wk11/12, 2010
                                                Prior        Actual
Composite Index - W/W Change   5.8 %    -14.4 %
Purchase Index - W/W Change     5.5 %      -5.0 %
Refinance Index - W/W Change    6.0 %    -16.5 %
By ECONODAY
An uptick in interest rates caused the slowdown in mortgage activity.


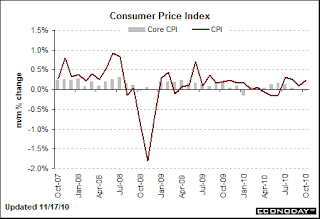
Consumer Price Index

Released on 11/17/2010 8:30:00 AM For Oct, 2010
                            Prior       Consensus       Range         Actual
CPI - M/M change 0.1 %        0.4 %      0.1 % to 0.4 %  0.2 %
CPI less f & e        0.0 %       0.1 %      0.0 % to 0.2 %  0.0 %
Higher energy prices were behind 0.2% gain, which was below expectations.
By ECONODAY


Housing Starts

Released on 11/17/2010 8:30:00 AM For Oct, 2010
                                   Prior           Consensus            Consensus Range           Actual
Starts - Level -   SAAR 0.610 M          0.590 M           0.570 M to 0.625 M       0.519 M
Permits - Level - SAAR 0.539 M                                                                   0.550 M
By ECONODAY


By ECONODAY

Monday, November 15, 2010

Data From 11.15.10

                                                   Prior    Consensus  Consensus Range    Actual

Retail Sales -              M/M change  0.6 %      0.7 %     0.4 % to 1.0 %     1.2 %
Retail Sales less autos - M/M change 0.4 %    0.4 %     0.2 % to 1.0 %      0.4 %


                                                            Prior    Consensus   Range       Actual

General Business Conditions Index - Level 15.73     15.0        9.0 to 18.0    -11.1


                                     Prior           Consensus       Range             Actual

Inventories - M/M change 0.6 %            0.9 %      0.4 % to 1.0     % 0.9 %

Wednesday, November 3, 2010

FOMC Statement 11.03.10

FOR IMMEDIATE RELEASE
Statement Regarding Purchases of Treasury Securities
On November 3, 2010, the Federal Open Market Committee (FOMC) decided to expand the Federal Reserve’s holdings of securities in the System Open Market Account (SOMA) to promote a stronger pace of economic recovery and to help ensure that inflation, over time, is at levels consistent with its mandate. In particular, the FOMC directed the Open Market Trading Desk (the Desk) at the Federal Reserve Bank of New York to purchase an additional $600 billion of longer-term Treasury securities by the end of the second quarter of 2011.
The FOMC also directed the Desk to continue to reinvest principal payments from agency debt and agency mortgage-backed securities into longer-term Treasury securities. Based on current estimates, the Desk expects to reinvest $250 to $300 billion over the same period, though the realized amount of reinvestment will depend on the evolution of actual principal payments.
Taken together, the Desk anticipates conducting $850 to $900 billion of purchases of longer-term Treasury securities through the end of the second quarter. This would result in an average purchase pace of roughly $110 billion per month, representing about $75 billion per month associated with additional purchases and roughly $35 billion per month associated with reinvestment purchases.

Thursday, April 29, 2010

Weekly Employment Report

UNEMPLOYMENT INSURANCE WEEKLY CLAIMS REPORT
SEASONALLY ADJUSTED DATA

In the week ending April 24, the advance figure for seasonally adjusted initial claims was 448,000, a decrease of 11,000 from the previous week's revised figure of 459,000. The 4-week moving average was 462,500, an increase of 1,500 from the previous week's revised average of 461,000.
The advance seasonally adjusted insured unemployment rate was 3.6 percent for the week ending April 17, unchanged from the prior week's unrevised rate of 3.6 percent.
The advance number for seasonally adjusted insured unemployment during the week ending April 17 was 4,645,000, a decrease of 18,000 from the preceding week's revised level of 4,663,000. The 4-week moving average was 4,639,000, a decrease of 9,000 from the preceding week's revised average of 4,648,000.
The fiscal year-to-date average of seasonally adjusted weekly insured unemployment, which corresponds to the appropriated AWIU trigger, was 5.186 million.
UNADJUSTED DATA
The advance number of actual initial claims under state programs, unadjusted, totaled 423,286 in the week ending April 24, a decrease of 11,171 from the previous week. There were 583,457 initial claims in the comparable week in 2009.
The advance unadjusted insured unemployment rate was 3.7 percent during the week ending April 17, a decrease of 0.1 percentage point from the prior week. The advance unadjusted number for persons claiming UI benefits in state programs totaled 4,779,335, a decrease of 144,978 from the preceding week. A year earlier, the rate was 4.7 percent and the volume was 6,339,490.
Extended benefits were available in Alabama, Alaska, Arizona, California, Colorado, Connecticut, Delaware, the District of Columbia, Georgia, Idaho, Illinois, Indiana, Kansas, Kentucky, Maine, Massachusetts, Michigan, Minnesota, Missouri, Montana, Nevada, New Hampshire, New Jersey, New Mexico, New York, North Carolina, Ohio, Oregon, Pennsylvania, Puerto Rico, Rhode Island, South Carolina, Tennessee, Texas, Vermont, Virginia, Washington, West Virginia, and Wisconsin during the week ending April 10.
Initial claims for UI benefits by former Federal civilian employees totaled 1,219 in the week ending April 17, a decrease of 224 from the prior week. There were 2,441 initial claims by newly discharged veterans, an increase of 23 from the preceding week.
There were 20,197 former Federal civilian employees claiming UI benefits for the week ending April 10, an increase of 113 from the previous week. Newly discharged veterans claiming benefits totaled 37,051, an increase of 455 from the prior week.
States reported 5,200,473 persons claiming EUC (Emergency Unemployment Compensation) benefits for the week ending April 10, a decrease of 146,641 from the prior week. There were 2,286,186 claimants in the comparable week in 2009. EUC weekly claims include first, second, third, and fourth tier activity.
The highest insured unemployment rates in the week ending April 10 were in Alaska (6.6 percent), Puerto Rico (6.4), Oregon (5.9), Wisconsin (5.6), Pennsylvania (5.4), Nevada (5.2), California (5.0), Idaho (5.0), Montana (5.0), Michigan (4.9), and North Carolina (4.9).
The largest increases in initial claims for the week ending April 17 were in Puerto Rico (+3,549), Iowa (+1,606), Georgia (+1,412), Connecticut (+768), and Florida (+422), while the largest decreases were in New York (-21,010), California (-15,380), Pennsylvania (-4,512), Oregon (-4,317), and New Jersey (-3,777).
Source: http://www.dol.gov/opa/media/press/eta/ui/current.htm

Wednesday, April 28, 2010

Federal Reserve Press Release 04.28.10

Press Release

Release Date: April 28, 2010
For immediate release
Information received since the Federal Open Market Committee met in March suggests that economic activity has continued to strengthen and that the labor market is beginning to improve. Growth in household spending has picked up recently but remains constrained by high unemployment, modest income growth, lower housing wealth, and tight credit. Business spending on equipment and software has risen significantly; however, investment in nonresidential structures is declining and employers remain reluctant to add to payrolls. Housing starts have edged up but remain at a depressed level. While bank lending continues to contract, financial market conditions remain supportive of economic growth. Although the pace of economic recovery is likely to be moderate for a time, the Committee anticipates a gradual return to higher levels of resource utilization in a context of price stability.
With substantial resource slack continuing to restrain cost pressures and longer-term inflation expectations stable, inflation is likely to be subdued for some time.
The Committee will maintain the target range for the federal funds rate at 0 to 1/4 percent and continues to anticipate that economic conditions, including low rates of resource utilization, subdued inflation trends, and stable inflation expectations, are likely to warrant exceptionally low levels of the federal funds rate for an extended period. The Committee will continue to monitor the economic outlook and financial developments and will employ its policy tools as necessary to promote economic recovery and price stability.
In light of improved functioning of financial markets, the Federal Reserve has closed all but one of the special liquidity facilities that it created to support markets during the crisis. The only remaining such program, the Term Asset-Backed Securities Loan Facility, is scheduled to close on June 30 for loans backed by new-issue commercial mortgage-backed securities; it closed on March 31 for loans backed by all other types of collateral.
Voting for the FOMC monetary policy action were: Ben S. Bernanke, Chairman; William C. Dudley, Vice Chairman; James Bullard; Elizabeth A. Duke; Donald L. Kohn; Sandra Pianalto; Eric S. Rosengren; Daniel K. Tarullo; and Kevin M. Warsh. Voting against the policy action was Thomas M. Hoenig, who believed that continuing to express the expectation of exceptionally low levels of the federal funds rate for an extended period was no longer warranted because it could lead to a build-up of future imbalances and increase risks to longer run macroeconomic and financial stability, while limiting the Committee’s flexibility to begin raising rates modestly.

Source: http://www.federalreserve.gov/

Friday, January 29, 2010

GDP


GDP Q/Q Change: Prev.2.2% Est.4.5% Act.5.7%

  1. Quickest growth rate in 6 years.
  2. Higher private sector inventory investment
  3. Lower imports


GDP Price Index
Q/Q Change: Prev. +0.4% Est. 1.3% Act.0.6%


Employment Cost Index

ECI Q/Q Change: Prev. 0.4% Est. 0.4 Act. 0.5%
ECI Y/Y Change: Prev 1.5% Act. 1.5%
The 1.5% Y/Y wage increase is below the 1.7% Y/Y CPI increase reported earlier in the month


Chicago Business Barometer Index

Chi BBI: Prev. 60.0 Est. 57 Act.61.5
New Orders +66.4 M/M (Fourth straight increae)
Production: 66.6


Consumer Sentiment Index

CSI: Prev. 72.8 Est. 73.0 Act 74.4

Thursday, January 28, 2010

Economic Data Snapshot for 01.28.10


New Claims Prior 482k Consensus 440k Actual 470k
4-week Moving Average Prior 448.25k Actual 456.25k
The 4-week moveing average rose for the second straight week reversing a down trend that began in September. Continuing claims fell but that is being distorted by the expiration of benefits.

New Orders-M/M change: Prior 0.2% Consensus 1.6% Actual 0.3%
New Orders-Y/Y Change: Prior -7.8% Consnsus ??? Actual -3.1%
The headline number was below expectations but an upward revision of the Nov. number
from -0.7 to -0.4


Weekly Change: Prior -245 Consensus -111 Actual -86

Monday, January 25, 2010

Economic Snapshot for 01.25.10

Existing Home Sales
Prior Est. Act.
Existing Home Sales - SAAR 6.54M 5.900M 5.45 M
Existing Home Sales - M/M Change -16.7 %
Existing Home Sales - Yr/Yr Change +15.0 %
Sales fell more than expected but the median price rose 1.5% from year-ago levels

Thursday, January 21, 2010

Economic Data Snapshot for 01.21.10

Weekly Jobs Report


Larger than expected jump in initial claims & 4 wk average increased for the 1st time in 6 months.

Leading Economic Indicators:
LEI +1.1% vs. +0.7% prev
CEI +0.1%


Philly Fed Survey

Actual +15.5 vs Expected +18.0 vs+20.4 prev

EIA Oil Inventoris

Crude -0.4 on week_________Gasoline +3.9_________Distillates -3.3


Wednesday, January 20, 2010

Economic Data Snapshot for 01.20.10

Producer Price Index

PPI MoM +0.2% vs +1.8%pr...YoY +4.7% vs +2.7%prev
MoM Less F&E 0.0% vs +0.5% YoY Less F&E

Number was in line with expectations and coincides with the Feds inflation outlook


Building Permits rise and
Housing Starts fall.

With economic data giving mixed readings, US market direction is being set by events in other parts of the globe. (Chinese tightening)

Blog Archive

Disclaimer

The contents of any third-party letters/reports above do not necessarily reflect the opinions or viewpoint of G. Scott Hinton. They are provided for informational/educational purposes only.All sites refered to or displayed on this blog are available to anyone free of charge. The content of any message or post by G. Scott Hinton anywhere on this site is not to be construed as constituting market or investment advice. Such is intended for educational purposes only. Individuals should always consult with their own advisors for specific investment advice. This information is not to be construed as an offer to sell or a solicitation or an offer to buy commodities herein named. The risk of trading futures and options can be substantial.