Showing posts with label Industrial Production. Show all posts

Tuesday, May 17, 2011

Recap for 5.17.11

Economic Data

ICSC-Goldman Store Sales
Released on 5/17/2011 7:45:00 AM For wk5/14, 2011

Prior
Actual
Store Sales - W/W change
0.0 %
-2.0 %
Store Sales - Y/Y
2.7 %
3.2 %
Housing Starts


Released on 5/17/2011 8:30:00 AM For Apr, 2011

Prior
Prior Revised
Consensus
Consensus Range
Actual
Starts - Level - SAAR
0.549 M
0.585 M
0.570 M
0.549 M to 0.583 M
0.523 M
Permits - Level - SAAR
0.594 M
0.574 M


0.551 M
Released on 5/17/2011 8:55:00 AM For wk5/14, 2011

Prior
Actual
Store Sales Y/Y change
4.7 %
-2.3 %


Industrial Production
                                                           

Iindustrial production was unchanged in April after having increased 0.7 percent in March. Output in February is now estimated to have declined 0.3 percent; previously it was reported to have edged up 0.1 percent. In April, manufacturing production fell 0.4 percent after rising for nine consecutive months. Total motor vehicle assemblies dropped from an annual rate of 9.0 million units in March to 7.9 million units in April, mainly because of parts shortages that resulted from the earthquake in Japan. Excluding motor vehicles and parts, factory production rose 0.2 percent in April. The output of mines advanced 0.8 percent, while the output of utilities increased 1.7 percent. At 93.1 percent of its 2007 average, total industrial production was 5.0 percent above its year-earlier level. The rate of capacity utilization for total industry edged down 0.1 percentage point to 76.9 percent, a rate 3.5 percentage points below its average from 1972 to 2010. (Source: http://www.federalreserve.gov/releases/g17/current/)


Released on 5/17/2011 9:15:00 AM For Apr, 2011

Prior
Prior Revised
Consensus
Consensus Range
Actual
Production - M/M change
0.8 %
0.7 %
0.4 %
-0.4 % to 0.8 %
0.0 %
Capacity Utilization Rate - Level
77.4 %
77.0 %
77.6 %
77.0 % to 77.9 %
76.9 %


Market Activity
Grains+1.90%
W+3.73% C+3.26% O+2.59% RR+2.02% SM+1.36% S+1.09% RS+0.95% BO+0.23%

Financials+0.26%
ZB+0.48% ZN+0.20% ZF+0.10% ED unch ZT unch
Metals+0.19%
HG+1.00% P+0.78% PL+0.40% GC-0.44% SI-0.62%             
Currencies+0.04%
SF+0.35% EC+0.33% AD+0.30% BP+0.27% MP+0.15% CD+0.08% USD-0.21% JY-0.73%
Softs-0.14%
CT+2.57% SB+1.19% KC+0.76% OJ-0.16% CC-0.90% LB-4.31%

Indices-0.19%
NQ+0.21% RJ+0.18% EW+0.16% ES+0.09% YM+0.08%        
Energies-0.47%
ZK+1.97% CL+0.12% RB+0.05% HO-0.33% NG-3.17%

Friday, January 14, 2011

CPI m/m Chg Prior: 0.1% Est 0.4%  Act: 0.5%
CPI less F&E  Prior:0.1%  Est:0.1% Act: 0.1%
 Broader CPI increase due to 4.6% rise in   energy prices.
Core prices held in check retailer competition
& weak housing
Retail Sales m/m Prior:0.8% Est: 0.8%  Act:0.6%
Less Autos          Prior:1.0% Est 0.7%  Act:0.5% 
Sales were below estimates. Higher gasoline
prices are reflected in the sales figures and November figures were stronger than expected.


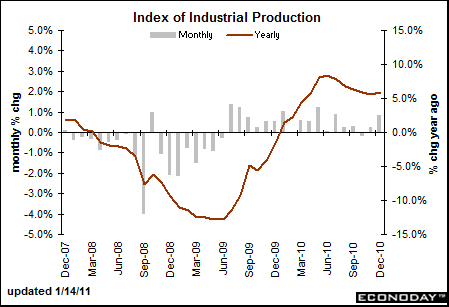
Ind Prod  m/m   Prior: 0.3% Est: 0.5% Act:0.8%
Utilization Rate   Prior: 75.4% Est: 75.6% Act:76.0%
Manufacturing continues to lead the recovery. Utilities output was up 4.3% due to unusally cold weather.


Consum Sentiment Prior:74.5 Est: 75.0 Act:72.  


Stocks continue to rally on earnings news.
20 out of the 24 companies reporting earnings this week came in above analysts expectations.


Commodity COT (Futs + Opts) (Click to view)

Financials COT (Futs + Opts) (Click to view)

Friday, January 15, 2010

Snapshot of Economic Data


CPI M/M +0.1% vs +0.1est Y/Y +2.8% vs +1.9%prior
Less F&E +0.1% vs 0.0% prev Y/Y +1.8% vs +1.7% prev


UoM 72.8 vs 72.5 ______IP 0.6% vs 0.8 _______

Empire Mfg 15.92 vs 2.55 prev


Disclaimer

The contents of any third-party letters/reports above do not necessarily reflect the opinions or viewpoint of G. Scott Hinton. They are provided for informational/educational purposes only.All sites refered to or displayed on this blog are available to anyone free of charge. The content of any message or post by G. Scott Hinton anywhere on this site is not to be construed as constituting market or investment advice. Such is intended for educational purposes only. Individuals should always consult with their own advisors for specific investment advice. This information is not to be construed as an offer to sell or a solicitation or an offer to buy commodities herein named. The risk of trading futures and options can be substantial.