Wednesday, September 26, 2012

Are Things Better Now?


It should surprise no one that the GOP is returning to their tried-and-untrue playbook to help out in this election cycle.  It has been long understood that Mr. Romney and Mr. Ryan want cut taxes, cut spending (except for the military) and roll-back government regulations. But now they are going back to the Gipper’s “Are we better off than we were four years ago?”   I did a quick Google.com/Bing.com search for September 2008 headlines and here is a sampling of what I found.

Financial Headlines from 4 Years Ago
September 2008

09.02.08 More weak data likely  (LA Times)
09.04.08 U.S. bankruptcy filing rate jumps (LA Times)
09.05.08 Ex-GOP lobbyist Abramoff sentenced to 4 years in prison (LA Times)
09.06.08 U.S. home woes mount (LA Times)
09.07.08 How Safe Is Your Bank? (LA Times)
09.08.08 U.S. seizes mortgage titans in multibillion-dollar rescue (LA Times)
09.10.08 Lehman fears sink Wall Street (LA Times)
09.11.08 Lehman posts $3.9-billion loss, moves to shore up books (LA Times)
09.12.08 WaMu plans another huge write-down (LA Times)
09.13.08 If Lehman fails, would you feel it? (LA Times)
09.14.08 Lehman Files for Bankruptcy; Merrill Is Sold (NY Times)
09.15.08 Wall St.’s Turmoil Sends Stocks Reeling (NY Times)
09.15.08 New York Allows A.I.G. to Lend Itself Money (NY Times)
09.16.08 Fed’s $85 Billion Loan Rescues Insurer (NY Times)
09.24.08 President Bush’s Speech to the Nation on the Economic Crisis (NY Times)
09.25.08 Talks Implode During a Day of Chaos; Fate of Bailout Plan Remains Unresolved
09.25.08 Government Seizes WaMu and Sells Some Assets (NY Times)
09.29.08 For Stocks, Worst Single-Day Drop in Two Decades (NY Times)
09.30.08 Republican Party, Having Brought You the Meltdown, Now Blames Obama (NY Times)


So go on, ask yourself, are we better off than we were four years ago?

Thursday, July 26, 2012

US Drought Monitor


Drought map shows widespread intensification over central United States

Jul 26, 2012
The July 24 U.S. Drought Monitor showed widespread intensification of drought through the middle of the country, according to the National Drought Mitigation Center at the University of Nebraska-Lincoln. The map also set a record for the fourth straight week for the area in moderate drought or worse in the 12-year history of the U.S. Drought Monitor.
The July 24 map put 53.44 percent of the United States and Puerto Rico in moderate drought or worse, up from 53.17 percent the week before; 38.11 percent in severe drought or worse, compared with 35.32 a week earlier; 17.2 percent in extreme drought or worse, compared with 11.32 percent the week before; and 1.99 percent in exceptional drought, up from .83 percent the preceding week.
“We’ve seen tremendous intensification of drought through Illinois, Iowa, Missouri, Indiana, Arkansas, Kansa and Nebraska, and into part of Wyoming and South Dakota in the last week,” said Brian Fuchs, a climatologist and U.S. Drought Monitor author. “The amount of D3 developing  in the country has increased  quite a bit for each of the last several weeks.”
Fuchs also noted that as of the July 24 U.S. Drought Monitor, every state in the country had at least a small area shown as abnormally dry or worse. “It’s such a broad footprint,” he said.
 “This drought is two-pronged,” Fuchs said. “Not only the dryness but the heat is playing a big and important role. Even areas that have picked up rain are still suffering because of the heat.”
The forecast for most of the drought-affected area is for drought to continue to develop and intensify. “Conditions are likely to persist,” Fuchs said. “We’ll see further development and intensification into the fall.” Fuchs based his assessment on the Seasonal Drought Outlook released July 19.
The U.S. Drought Monitor map is jointly produced by the National Drought Mitigation Center at the University of Nebraska-Lincoln, the National Oceanic and Atmospheric Administration, the U.S. Department of Agriculture, and about 350 drought observers across the country. It is released each Thursday based on data through the previous Tuesday.
Drought Monitor authors synthesize many drought indicators into a single map that identifies areas of the country that are abnormally dry (D0), in moderate drought (D1), in severe drought (D2), extreme drought (D3) and exceptional drought (D4).
Statistics for the percent area in each category of drought are automatically added to the U.S. Drought Monitor website each week for the entire country and Puerto Rico, for the 48 contiguous states, for each climate region, and for individual states: http://drought.unl.edu/MonitoringTools/USDroughtMonitor/DroughtMonitorTips.aspx
The National Climatic Data Center maintains drought data based on the Palmer Drought Severity Index, calculated to the beginning of the historic record:http://www1.ncdc.noaa.gov/pub/data/cmb/sotc/drought/2012/06/uspctarea-wetdry-mod.txt
U.S. Drought Monitor: http://droughtmonitor.unl.edu
-- Kelly Helm Smith, National Drought Mitigation Center

Monday, July 23, 2012

Crop Conditions as of 07.22.12

USDA Crop Progress Report
Crop conditions continue to worsen. Scattered rains have hit some areas. Certain areas in Missouri have not had rain since before Memorial Day. 
GSH


Corn Condition - Selected States: Week Ending July 22, 2012
[National crop conditions for selected States are weighted based on 2011
planted acreage]
----------------------------------------------------------------------------
      State    : Very poor :  Poor    :  Fair    :  Good    : Excellent 
----------------------------------------------------------------------------
                :                          percent                          
                :                                                          
Colorado .......:    21          23          26          27          3    
Illinois .......:    36          30          27          7          -    
Indiana ........:    38          33          22          6          1    
Iowa ...........:    14          26          37          21          2    
Kansas .........:    28          31          29          11          1    
Kentucky .......:    43          34          17          5          1    
Michigan .......:    27          24          26          21          2    
Minnesota ......:    3          8          28          53          8    
Missouri .......:    48          31          16          4          1    
Nebraska .......:    14          19          30          32          5    
North Carolina .:    2          13          32          39          14    
North Dakota ...:    2          9          31          54          4    
Ohio ...........:    21          31          33          14          1    
Pennsylvania ...:    4          10          33          40          13    
South Dakota ...:    13          22          34          29          2    
Tennessee ......:    25          30          27          17          1    
Texas ..........:    4          7          38          40          11    
Wisconsin ......:    19          24          26          24          7    
                :                                                          
18 States ......:    21          24          29          23          3    
                :                                                          
Previous week ..:    16          22          31          27          4    
Previous year ..:    5          9          24          46          16    
----------------------------------------------------------------------------


Soybean Condition - Selected States: Week Ending July 22, 2012
[National crop conditions for selected States are weighted based on 2011
planted acreage]
----------------------------------------------------------------------------
      State    : Very poor :  Poor    :  Fair    :  Good    : Excellent 
----------------------------------------------------------------------------
                :                          percent                          
                :                                                          
Arkansas .......:    4          17          31          40          8    
Illinois .......:    24          25          38          12          1    
Indiana ........:    23          30          35          11          1    
Iowa ...........:    10          20          42          25          3    
Kansas .........:    20          31          35          14          -    
Kentucky .......:    23          33          28          14          2    
Louisiana ......:    -          6          30          53          11    
Michigan .......:    13          27          31          27          2    
Minnesota ......:    3          9          28          54          6    
Mississippi ....:    3          4          22          50          21    
Missouri .......:    31          37          24          7          1    
Nebraska .......:    10          22          40          26          2    
North Carolina .:    1          8          33          50          8    
North Dakota ...:    1          8          32          53          6    
Ohio ...........:    14          30          36          19          1    
South Dakota ...:    4          20          42          31          3    
Tennessee ......:    6          15          40          37          2    
Wisconsin ......:    12          21          32          26          9    
                :                                                          
18 States ......:    13          22          34          27          4    
                :                                                          
Previous week ..:    10          20          36          30          4    
Previous year ..:    3          8          27          49          13    
----------------------------------------------------------------------------

Thursday, July 19, 2012

US Seasonal Drought Outlook NWS/CPC

Climate Prediction Center Website


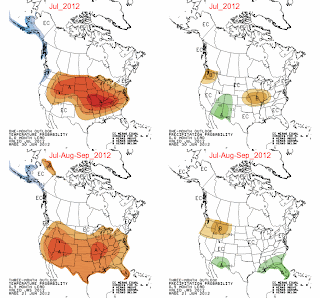
Latest Seasonal Assessment - Dryness and drought, exacerbated by above-normal temperatures, have been increasing both in extent and intensity across much of the central and northern U.S. Based upon the July 10 U.S. Drought Monitor, nearly 61 percent of the contiguous U.S. was in drought (D1-D4), the highest such value for the U.S. Drought Monitor since its inception in 2000. The drought and heat arrived at a critical time for Midwestern agriculture, especially corn. The combination of heat and dryness has severely reduced the quality and quantity of the corn and soybean crop, with 38 percent of the corn and 30 percent of the soybeans rated as poor or very poor as of July 15 by NASS/USDA. Some states, such as Kentucky, Missouri, and Indiana, had over 70 percent of their corn adversely rated. Unfortunately, drought is expected to develop, persist, or intensify across these areas, and temperatures are likely to average above normal. Some widely-scattered relief may come in the form of cold front passages or organized thunderstorm clusters (MCSs), but widespread relief for much of the area is not expected. In the Southeast, recent widespread thunderstorm activity has slightly eased drought there, and the 3-month outlook favors increased odds for above normal precipitation along the central Gulf. This is due to the greater likelihood of a tropical system affecting these areas and from sea-breeze triggered thunderstorms. Therefore, some improvement is expected across the Deep South, from coastal Texas eastward to South Carolina. Across the Southwest, the odds favor an active (wet) southwest monsoon in both the 1- and 3-month precipitation outlooks. As a result, improvement is anticipated across much of Arizona and western New Mexico as the summer monsoon continues, with some improvement in other parts of the region. Drought persistence is the best bet across the remaining portions of the Western U.S. since late summer and early fall are typically dry. In Hawaii, subnormal seasonal rainfall is expected which should maintain drought on the leeward (west) sides while expanding it toward the windward (east) sides. Lastly, an El Niño Watch continues, with the forecaster consensus reflecting increased chances of an El Niño beginning in July-September.
Forecaster: D. Miskus
Next Outlook issued: August 2, 2012 at 8:30 AM EDT

Monday, July 16, 2012

NOAA National Drought Overview

NOAA State of Climate Drought June 2012

National Drought Overview

Crop Progress as of 7.15.12


Information gathered from
http://www.usda.gov/oce/weather/pubs/Daily/TODAYSWX.pdf

http://usda.mannlib.cornell.edu/MannUsda/viewDocumentInfo.do?documentID=1048


Agricultural Weather Highlights – Monday - July 16, 2012
 In the West, scattered monsoon showers stretch from the Arizona-New Mexico border northward into the Intermountain region. In addition, much cooler weather prevails in the wake of last week’s heat wave.
 On the Plains, another crop- and pasture-withering heat wave is underway. Sunday’s high temperatures
generally ranged from 95 to 110°F, except for somewhat cooler conditions on the northern High Plains, and
similar readings can be expected again today.
 In the Corn Belt, weekend showers provided only limited and localized relief from the worst drought since
1988. Today’s temperatures will again peak near 95°F in many sections of the Midwest, with a few readings
near 100°F possible in the western Corn Belt.
 In the South, summer crops and pastures continue to benefit from recent soil moisture improvements, despite a return to very warm, mostly dry weather. Last week’s rainfall totaled 4 inches or more in many locations from the western Gulf Coast region into the southern Appalachians.

Outlook: Heat has returned to the Plains and Midwest and will persist for much of the week. Triple-digit (100-degree) heat will continue indefinitely on the central Plains and occasionally spread to the northern and southern Plains and the western Corn Belt. Later in the week, portions of the eastern Corn Belt may experience temporary relief from highs above 90°F. Showers and thunderstorms will accompany the eastern Corn Belt’s transition to slightly cooler weather, although rainfall amounts will be mostly less than an inch. Like last week, more substantial
rainfall will occur mostly south of the Ohio River, where 1- to 3-inch totals can be expected across the Southeast. Elsewhere, mostly dry weather on the central and southern Plains will contrast with scattered showers in the Four Corners region and across the nation’s northern tier. The NWS 6- to 10-day outlook for July 21-25 calls for hotter than- normal weather nationwide, except along the Pacific Coast. Meanwhile, drier-than-normal conditions across
the vast majority of the U.S. will contrast with pockets of above-normal rainfall in the central and southern

Corn Condition - Selected States: Week Ending July 15, 2012
[National crop conditions for selected States are weighted based on 2011
planted acreage]
----------------------------------------------------------------------------
      State    : Very poor :  Poor    :  Fair    :  Good    : Excellent
----------------------------------------------------------------------------
                :                          percent                        
                :                                                        
Colorado .......:    17          21          29          29          4  
Illinois .......:    26          30          33          10          1  
Indiana ........:    37          34          21          7          1  
Iowa ...........:    8          19          37          32          4  
Kansas .........:    21          30          34          14          1  
Kentucky .......:    38          39          17          5          1  
Michigan .......:    27          29          26          16          2  
Minnesota ......:    2          7          24          56          11  
Missouri .......:    38          34          21          6          1  
Nebraska .......:    9          18          30          39          4  
North Carolina .:    3          14          27          43          13  
North Dakota ...:    1          8          29          56          6  
Ohio ...........:    19          28          34          18          1  
Pennsylvania ...:    5          11          45          30          9  
South Dakota ...:    7          20          36          33          4  
Tennessee ......:    25          30          27          17          1  
Texas ..........:    5          6          33          42          14  
Wisconsin ......:    19          24          27          25          5  
                :                                                        
18 States ......:    16          22          31          27          4  
                :                                                        
Previous week ..:    12          18          30          34          6  
Previous year ..:    4          7          23          50          16  

Soybean Condition - Selected States: Week Ending July 15, 2012
[National crop conditions for selected States are weighted based on 2011
planted acreage]
----------------------------------------------------------------------------
      State    : Very poor :  Poor    :  Fair    :  Good    : Excellent 
----------------------------------------------------------------------------
                :                          percent                          
                :                                                          
Arkansas .......:    3          16          34          39          8    
Illinois .......:    16          25          42          16          1    
Indiana ........:    25          32          32          10          1    
Iowa ...........:    5          15          42          34          4    
Kansas .........:    14          27          39          19          1    
Kentucky .......:    21          31          32          15          1    
Louisiana ......:    1          7          31          51          10    
Michigan .......:    16          34          28          21          1    
Minnesota ......:    1          8          26          57          8    
Mississippi ....:    2          5          20          50          23    
Missouri .......:    25          34          31          9          1    
Nebraska .......:    7          16          43          33          1    
North Carolina .:    1          5          33          55          6    
North Dakota ...:    -          6          32          56          6    
Ohio ...........:    14          28          36          20          2    
South Dakota ...:    3          17          39          37          4    
Tennessee ......:    10          17          39          32          2    
Wisconsin ......:    16          23          31          25          5    
                :                                                          
18 States ......:    10          20          36          30          4    
                :                                                          
Previous week ..:    9          18          33          35          5    
Previous year ..:    3          7          26          51          13    

Thursday, July 12, 2012

Short Term Drought Maps 6.23.12 vs 7.7.12

Short Term Drought 6.23.12

Short Term Drought 7.7.12

Monday, July 9, 2012

Crop Conditions Worsen


Corn Condition - Selected States: Week Ending July 8, 2012
[National crop conditions for selected States are weighted based on 2011
planted acreage]
----------------------------------------------------------------------------
  State     : Very poor :   Poor    :   Fair    :   Good   : Excellent 
-----------------------------------------------------------------------
                                   percent                          
Colorado .......:    16          22          31          28           3     
Illinois .......:    23          25          33          17           2     
Indiana ........:    27          34          27          11           1     
Iowa ...........:     5          13          36          40           6     
Kansas .........:    15          28          38          18           1     
Kentucky .......:    34          38          23           5           -     
Michigan .......:    13          28          26          29           4     
Minnesota ......:     1           4          18          62          15     
Missouri .......:    28          32          28          11           1     
Nebraska .......:     7          13          33          40           7     
North Carolina .:     2          16          35          37          10     
North Dakota ...:     1           4          21          64          10     
Ohio ...........:    12          24          36          25           3     
Pennsylvania ...:     3           9          33          42          13     
South Dakota ...:     3          10          27          51           9     
Tennessee ......:    29          32          27          11           1     
Texas ..........:     4           8          29          47          12     
Wisconsin ......:    12          19          26          36           7     
                :                                                           
18 States ......:    12          18          30          34           6     
                :                                                           
Previous week ..:     7          15          30          40           8     
Previous year ..:     3           6          22          52          17     
----------------------------------------------------------------------------
 Soybean Condition - Selected States: Week Ending July 8, 2012
[National crop conditions for selected States are weighted based on 2011
planted acreage]
----------------------------------------------------------------------------
      State     : Very poor :   Poor    :   Fair    :   Good    : Excellent 
----------------------------------------------------------------------------
                :                          percent                          
                :                                                           
Arkansas .......:     4          16          32          40           8     
Illinois .......:    17          25          38          18           2     
Indiana ........:    21          30          35          13           1     
Iowa ...........:     4          11          37          42           6     
Kansas .........:     8          25          42          24           1     
Kentucky .......:    23          39          30           8           -     
Louisiana ......:     1           9          35          46           9     
Michigan .......:    11          29          26          29           5     
Minnesota ......:     1           6          21          64           8     
Mississippi ....:     2           8          19          46          25     
Missouri .......:    23          31          33          12           1     
Nebraska .......:     5          14          40          38           3     
North Carolina .:     -           9          35          49           7     
North Dakota ...:     1           5          23          60          11     
Ohio ...........:    11          25          37          24           3     
South Dakota ...:     2          10          29          51           8     
Tennessee ......:    15          24          35          24           2     
Wisconsin ......:    11          20          28          36           5     
                :                                                           
18 States ......:     9          18          33          35           5     
                :                                                           
Previous week ..:     7          15          33          39           6     
Previous year ..:     2           6          26          52          14   

Wednesday, May 30, 2012

What is Wrong With This Picture?

Year to Date
WTI -11%
Gasoline (US avg) +11.5%
Gasoline (Chicago) +15.0%

Crude Futures -15% Y-T-D
RBOB Futures -1.6% Y-T-D


Ample Crude Supplies
   a

Gasoline Supplies Tight

Thursday, March 8, 2012

The More Things Stay The Same The More The Story Changes


That was then....
2008 Fox News Reporting on High Gas Prices (by Media Matters)   

Gasoline
 Initially gasoline price fell by  about 20% from the time Pres. Bush took office due to a 45% decline in the stock market. As the equity market improved, gasoline prices moved higher, gaining almost 290% before the bubble burst. At the end of his term gasoline prices gasoline prices were 35% higher than when he took office.


US Dollar

In 2001 and 2002 the USD posted 10% gains. The
dollar was under pressure for the remainder of the Bush presidency, losing as much as 35% of it's value. There was a slight rebound but the USD lost 23% during the Bush year.
Gold

Gold prices rallied during the Bush years. By the summer of 2008 gold price were up more than 280% . When Pres Bush left office gold had gained about 220% over his presidency


In the first two years of his term stocks lost almost 45% of their value. At the beginning of 2008 the stock market was up by about 15% since President Bush took office,  As the financial crisis expanded, equities plunged and for the second time in his term stocks had lost about 45% of their January '01value'


This is now...
2012 Fox News Reporting On High Gas Prices (by Media Matters)


Gasoline


The Fox News pundits are correct when they say they gas prices have risen almost 160% since Pres. Obama took office


US Dollar


The USD has remained under pressure, but is 13% higher than the Bush lows.


The bull market in gold has continued during Pres Obama's term, jumping as much 110% from  when he took office January '09. Gold has pulled back from its high but it is up 83%.


The stock market was still in a free-fall when Pres Obama took office and stocks lost almost 20% of their value before the effects of the stimulus programs kicked in. Equities rallied until mid 2010 then had a small retracement. The rally resumed and stocks posted a new high for the move before pausing and pulling back once again. As of this writing, stocks are testing the post-crash highs of 2011.


Anyway, all I can say is...Thank Goodness For Organizations Like "Media Matters" as they continue to point out the fallacies that flow from Fox.  

Blog Archive

Disclaimer

The contents of any third-party letters/reports above do not necessarily reflect the opinions or viewpoint of G. Scott Hinton. They are provided for informational/educational purposes only.All sites refered to or displayed on this blog are available to anyone free of charge. The content of any message or post by G. Scott Hinton anywhere on this site is not to be construed as constituting market or investment advice. Such is intended for educational purposes only. Individuals should always consult with their own advisors for specific investment advice. This information is not to be construed as an offer to sell or a solicitation or an offer to buy commodities herein named. The risk of trading futures and options can be substantial.