Please be Advised
The "Futures Insights" blog will
not be published from
03.24.11 thru 04.04.11

We will be on Spring Break
| Purchase Index - W/W Change | Prev -4.0 % | Act 2.7 % |
| Refinance Index - W/W Change | 0.9 % | 2.7 % |
| Composite Index - W/W Change | -0.7 % | 2.7 % |

| New Home Sales - Level - | Prev 284 K | Rev 329 K | Est 290 K | Range 240 K to 305 K | Act 250 K |
Store Sales - W/W change | Prior 0.1 % | Actual -0.1 % |
Store Sales - Y/Y | 3.1 % | 3.0 % |
Store Sales Y/Y change | Prior 2.0 % | Actual 2.4 % |
 |
| NGJ11 |
 |
| SPX |
 |
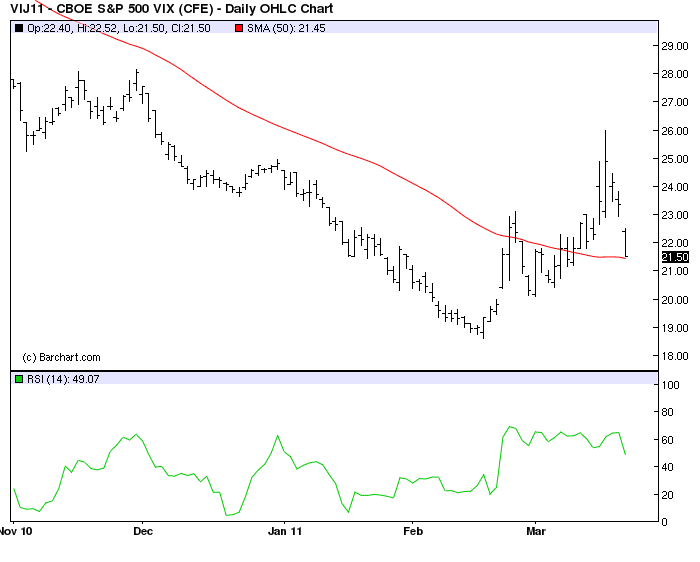
| VIX |

| Existing Home Sales Existing Home Sales - Level - | Prior 5.36 M | Revised 5.40 M | Est 5.150 M | Range 5.000 M to 5.230 M | Actual 4.88 M |
| Existing Home Sales - M/M Change | 2.7 % | 3.4 % | | | -9.6 % |
| Existing Home Sales - Yr/Yr Change | 5.3 % | | | | -2.8 % |