Economic Data

| Existing Home Sales Existing Home Sales - Level - | Prior 5.36 M | Revised 5.40 M | Est 5.150 M | Range 5.000 M to 5.230 M | Actual 4.88 M |
| Existing Home Sales - M/M Change | 2.7 % | 3.4 % | | | -9.6 % |
| Existing Home Sales - Yr/Yr Change | 5.3 % | | | | -2.8 % |
Home sales fell 10% last month and are down 2.8% y-o-y. Both single-family and condo sales declined. Existing Home sales peaked in 2005. Distressed sales were 39% of sales transaction. 33% of sales were cash transactions.. In February, the median price fell 1.1% to $156k.
Market Activity
Indices +1.70% Story from Reuters
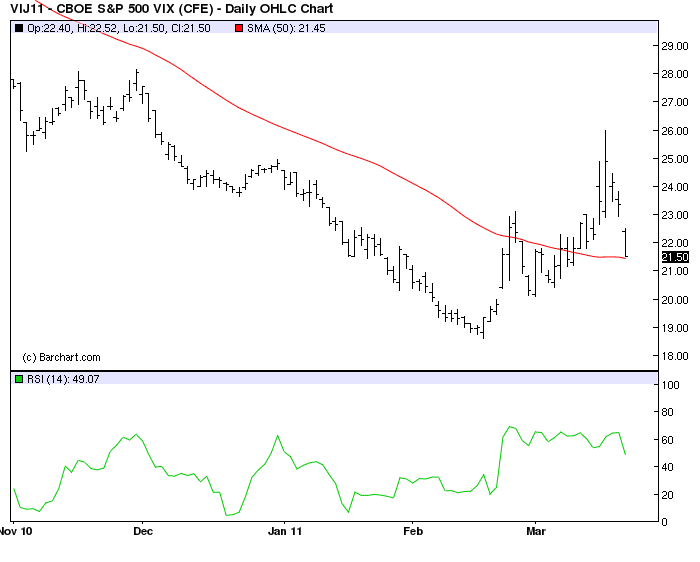
Midcap +1.97% Russell 2K +1.96% NQ +1.78% ES+1.43% Mini Dow +1.40% VIX -7.49%
Metals +1.13%
SI +3.04% PA +2.02% PL +1.31% GC +0.82% HG -1.23%
Energies +0.68%
RB +1.58% CL +1.22% HO +0.99% Ethanol +0.04% NG -0.31%
Currencies +0.35%
AD +0.94% CD +0.79% MP +0.70% BP+0.60% EC +0.49% JY-0.14% SF -0.38% USD -0.41%
Grains +0.20%
RR +1.47% C+0.44% BO +0.20% S +0.04% W-0.28% SM -0.41% O -0.57%
Financials -0.25%
ED -0.01% TU -0.09% US
Softs -0.32%
CC +1.98% KC +0.29% LB unch CT -0.08% SB -0.83% OJ -3.30%
Charts

No comments:
Post a Comment